[toc]
gunicorn vs uwsgi
前言
以下测试都是基于应用代码没有做改变的情况(如果使用gevent优化一下monkey patch应该会好点)
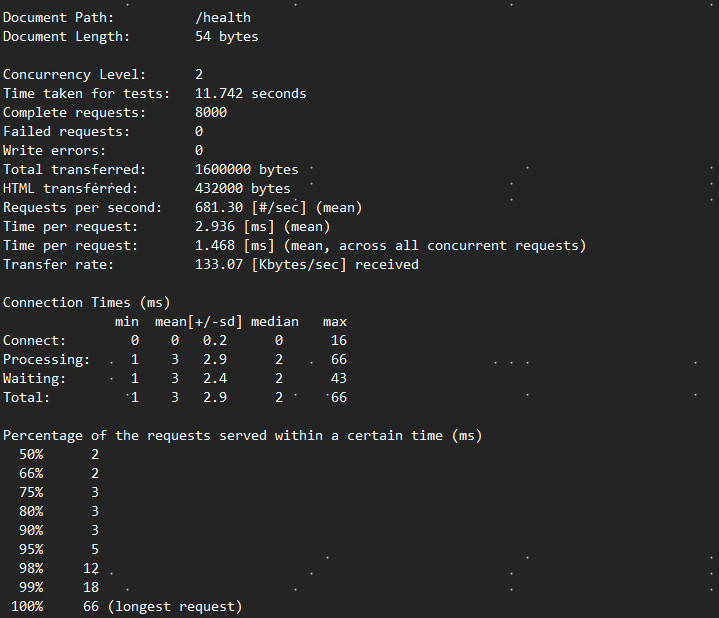
werkzeug
RPS:681.30/sec
gunicorn
配置
import multiprocessing
bind = '0.0.0.0:8203'    #绑定的ip及端口号
workers = multiprocessing.cpu_count() * 2 + 1
threads = 2560
backlog = 2048        #监听队列,允许挂起的链接数
worker_class = "eventlet"
debug = True
chdir = 'xxxx'
proc_name = 'gunicorn.proc'
daemon = True
pidfile = "./gunicorn.pid"
reload=True
accesslog = "./access.log"
errorlog = "./error.log"
work class对比
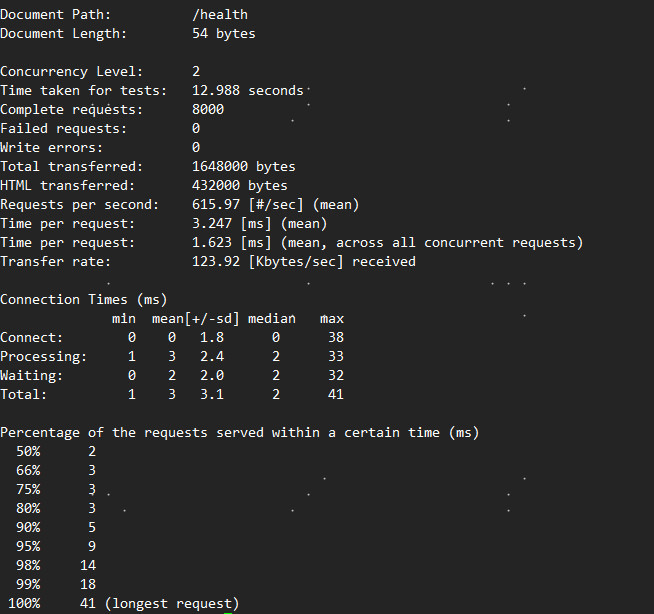
sync
RPS:615.97/sec
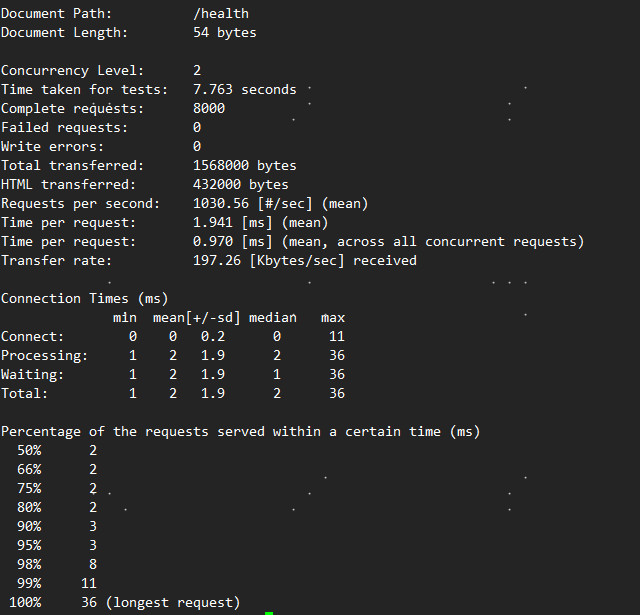
gevent
RPS:1030.56/sec
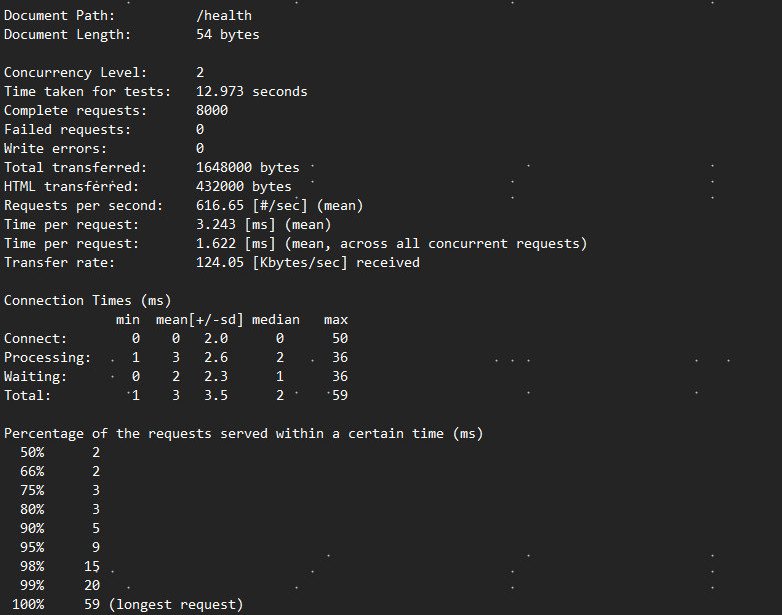
eventlet(preload模式)
RPS:616.65/sec
eventlet(非preload模式)
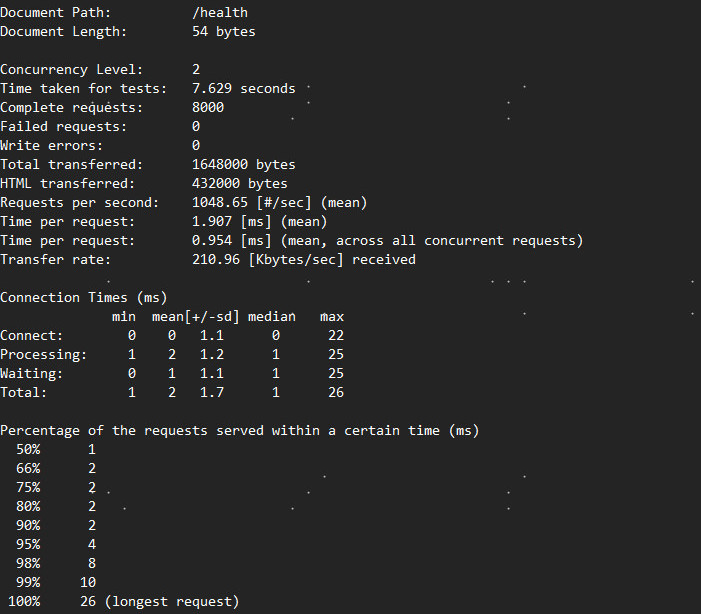
RPS:1048.65/sec
gunicorn小结
werkzeug:RPS:681.30/sec
sync:RPS:615.97/sec
gevent:RPS:1030.56/sec
eventlet(preload模式):RPS:616.65/sec
eventlet(非preload模式):1048.65/sec
uwsgi+nginx
配置
实际上配置是uwsgi+nginx,因为使用uwsgi再使用http方式直接提供接口效率确实不好,所以直接使用socket的方式,然后nginx使用uwsgi代理
[uwsgi]
projectpath = xxx
master = master
max-requests = 20000000
processes = 33
enable-threads = true
thunder-lock = true
lazy-apps = false
chmod-socket = 664
buffer-size = 65536
pythonpath = %(projectpath)/timer_app
module = run
wsgi-file = run.py
callable = app
venv = %(projectpath)/.venv
socket = :8203
pidfile = %(projectpath)/deploy_config/pid_%n.pid
master-fifo = %(projectpath)/deploy_config/fifo_%n.fifo
stats = %(projectpath)/deploy_config/stats_%n.stats
#daemonize = %(projectpath)/logs/uwsgi_log.log
#disable-logging = true
vacuum = true
listen = 4096
reaper = true
测试点
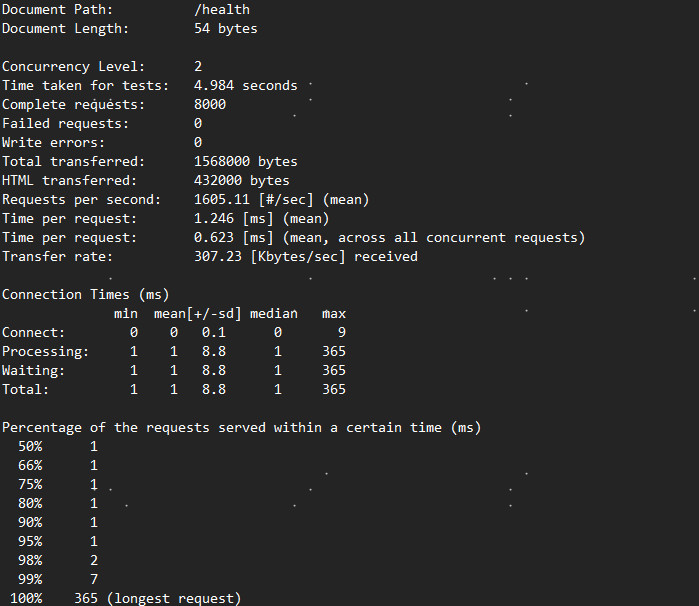
打印日志
RPS:1605.11/sec
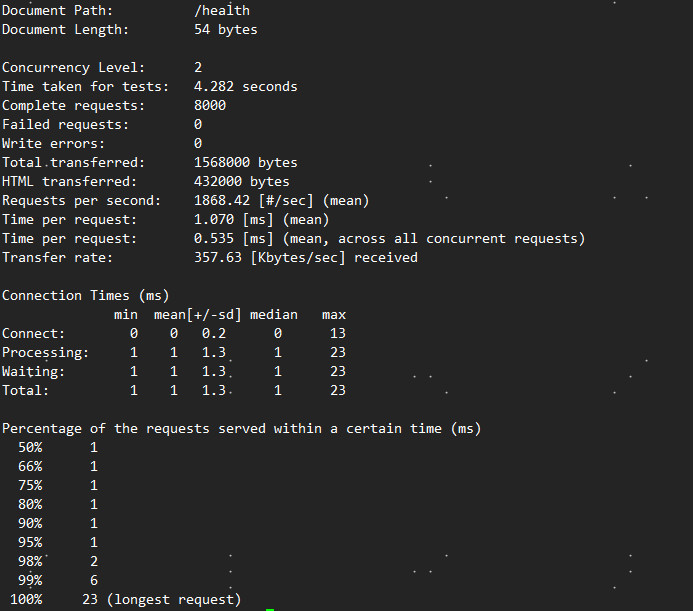
不打印日志(preload模式)
RPS:1868.42/sec
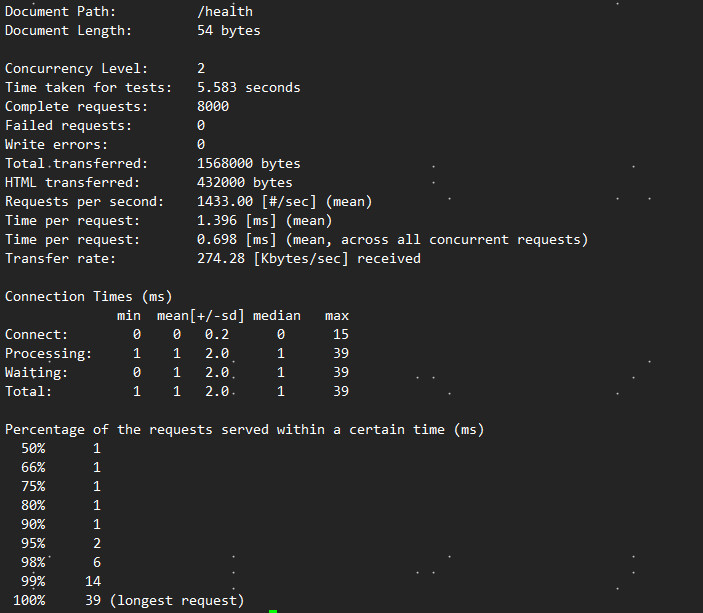
不打印日志(非preload模式)
RPS:1433.42/sec
gunicorn+nginx+eventlet
RPS:1030.56/sec

uwsgi小结
打印日志:RPS:1605.11/sec
不打印日志(preload模式):RPS:1868.42/sec
不打印日志(非preload模式):RPS:1433.42/sec
gunicorn+nginx+eventlet:RPS:1030.56/sec
总结
gunicorn 最好使用eventlet(非preload模式)
uwsgi+nginx 最好使用不打印日志(preload模式)
gunicorn与uwsgi比较最好使用uwsgi
性能测试命令ab
[root@VM_0_13_centos /]# ab -c 2 -n 8000 url
This is ApacheBench, Version 2.3 <$Revision: 655654 $>
Copyright 1996 Adam Twiss, Zeus Technology Ltd, http://www.zeustech.net/
Licensed to The Apache Software Foundation, http://www.apache.org/

Benchmarking www.myvick.cn (be patient).....done


Server Software:        nginx/1.13.6   #测试服务器的名字
Server Hostname:        www.myvick.cn  #请求的URL主机名
Server Port:            80             #web服务器监听的端口

Document Path:          /index.php    #请求的URL中的根绝对路径,通过该文件的后缀名,我们一般可以了解该请求的类型
Document Length:        799 bytes       #HTTP响应数据的正文长度

Concurrency Level:      10        # 并发用户数,这是我们设置的参数之一
Time taken for tests:   0.668 seconds   #所有这些请求被处理完成所花费的总时间 单位秒
Complete requests:      100         # 总请求数量,这是我们设置的参数之一
Failed requests:        0          # 表示失败的请求数量,这里的失败是指请求在连接服务器、发送数据等环节发生异常,以及无响应后超时的情况
Write errors:           0
Total transferred:      96200 bytes    #所有请求的响应数据长度总和。包括每个HTTP响应数据的头信息和正文数据的长度
HTML transferred:       79900 bytes    # 所有请求的响应数据中正文数据的总和,也就是减去了Total transferred中HTTP响应数据中的头信息的长度
Requests per second:    149.71 [#/sec] (mean) #吞吐率,计算公式:Complete requests/Time taken for tests  总请求数/处理完成这些请求数所花费的时间
Time per request:       66.797 [ms] (mean)   # 用户平均请求等待时间,计算公式:Time token for tests/(Complete requests/Concurrency Level)。处理完成所有请求数所花费的时间/(总请求数/并发用户数)
Time per request:       6.680 [ms] (mean, across all concurrent requests) #服务器平均请求等待时间,计算公式:Time taken for tests/Complete requests,正好是吞吐率的倒数。也可以这么统计:Time per request/Concurrency Level
Transfer rate:          140.64 [Kbytes/sec] received  #表示这些请求在单位时间内从服务器获取的数据长度,计算公式:Total trnasferred/ Time taken for tests,这个统计很好的说明服务器的处理能力达到极限时,其出口宽带的需求量。

Connection Times (ms)
              min  mean[+/-sd] median   max
Connect:        1    2   0.7      2       5
Processing:     2   26  81.3      3     615
Waiting:        1   26  81.3      3     615
Total:          3   28  81.3      6     618

Percentage of the requests served within a certain time (ms)
  50%      6
  66%      6
  75%      7
  80%      7
  90%     10
  95%    209
  98%    209
  99%    618
 100%    618 (longest request)

#Percentage of requests served within a certain time(ms)这部分数据用于描述每个请求处理时间的分布情况,比如以上测试,80%的请求处理时间都不超过7ms,这个处理时间是指前面的Time per request,即对于单个用户而言,平均每个请求的处理时间